1.3. Getting to know QGIS
1.3.1.  Getting the files
Get the files from brightspace, and unzip to a location of your choice. All
relevant files are stored in a GeoPackage and additional tabular data is stored
in an .xlsx file. Files like these are very useful for easy data
management in Libreoffice Calc or MS Excel. Furthermore, they are also editable
in QGIS or Python.
1.3.2. Introduction to the interface
For an introduction to the interface, follow interface_overview.
Then, try adding your own maps to the interface. These are
Hadocha_dem, Hadocha_landuse and Hadocha_soil.
1.3.3. Changing layer Symbology
The symbology of a layer is its visual appearance on the map. The basic strength of GIS over other ways of representing data with spatial aspects is that with GIS, you have a dynamic visual representation of the data you’re working with.
Therefore, the visual appearance of the map (which depends on the symbology of the individual layers) is very important. The end user of the maps you produce will need to be able to easily see what the map represents. Equally as important, you need to be able to explore the data as you’re working with it, and good symbology helps a lot.
In other words, having proper symbology is not a luxury or just nice to have. In fact, it’s essential for you to use a GIS properly and produce maps and information that people will be able to use.
1.3.4. Follow Along: Legend with unique values
To change a layer’s symbology, open its Layer Properties. Let’s begin by changing the color of the Hadocha_landuse layer.
Right-click on the Hadocha_landuse layer in the layers list.
Select the menu item Properties… in the menu that appears.
Note
By default, you can also access a layer’s properties by double-clicking on the layer in the Layers list.
Tip
The
 button at the top of the Layers
panel will open the Layer Styling panel. You can use this
panel to change some properties of the layer: by default, changes will be
applied immediately!
button at the top of the Layers
panel will open the Layer Styling panel. You can use this
panel to change some properties of the layer: by default, changes will be
applied immediately!
In the Layer Properties window, select the
Symbology tab: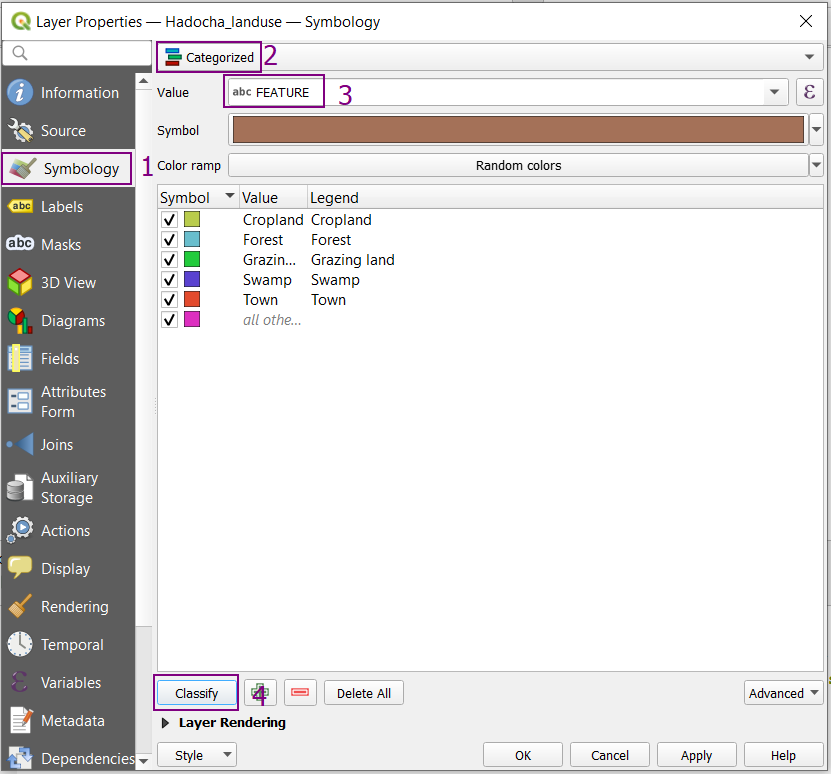
In the top drop-down menu, select
 Categorized.
In the Value drop-down, select

FEATURE.Click Classify to load all values into the list.
In the Symbol drop-down menu, you can select a colour for each attribute
 .
.Click OK again in the Layer Properties window, and you will see the color change being applied to the layer.
Tip
In the you can save your symbology to the layer, so it will be loaded like this into another QGIS project.
1.3.5. Try Yourself
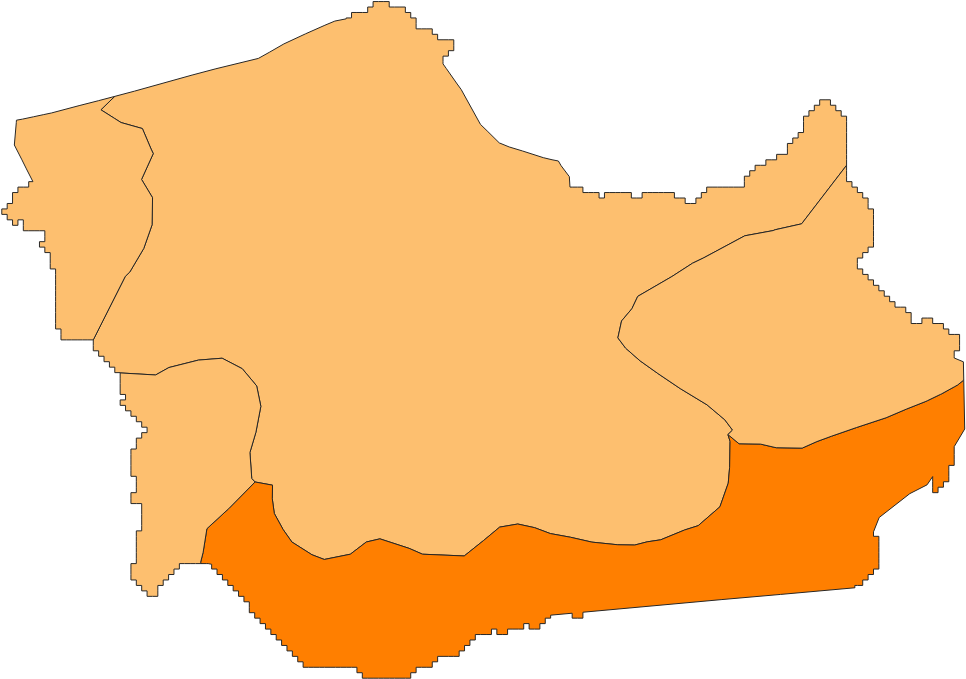
Change the colours of the Hadocha_soil layer to matching shades of brown for the different soiltypes. Try using the Layer Styling panel this time.
Solution
Your layer should look somethig like this: